Blog
Stay informed on the latest news and developments
Webinar Q&A Series Part 1 – Finch West Light Rail Transit

In our joint webinar with GKM Consultants, we discussed the background, challenges, and solution developed for the Finch West Light Rail Transit Line 6 construction project. GKM’s demonstrated experience is evident with their execution and scheduled roll out of monitoring activities encompassing 1,200+ monitoring points across the length of the 11-km light rail transit alignment, and 18 associated stations.
We were both delighted with the large webinar turnout and received many fantastic questions. Since time was limited during the live session, we have compiled many of the answers that were not initially responded to into a two-part Q&A series – as a further resource to attendees.
We appreciate everyone’s interest and participation, and remain available to answer additional questions. Feel free to submit them using the form at the bottom of this page. Webinar replay is available on-demand for those who were unable to attend the live presentation.
Q. What constraints had to be imposed on the monitoring program in order to achieve good quality communication with instrument locations?
Wesley Saunders, P. Eng. | Business Development Manager, GKM Consultants
A. Typically to maintain good quality communication between the gateway and wireless node locations we need to minimize the disturbance of the fresnel zone. We can achieve this by strategic positioning of the antennas at suitable height and clearance from impacting structures, selection of appropriate hardware such as roadway rated antennas as well as the selection of materials such as fiberglass enclosures or PVC caps that don’t impede transmission.
Q. What is the reason for using both the Loadsensing nodes and the sensemetrics nodes? Could the system work directly with instruments plugged directly into the sensemetrics nodes?
Todd Roberts, P.G. | Director of Infrastructure, sensemetrics
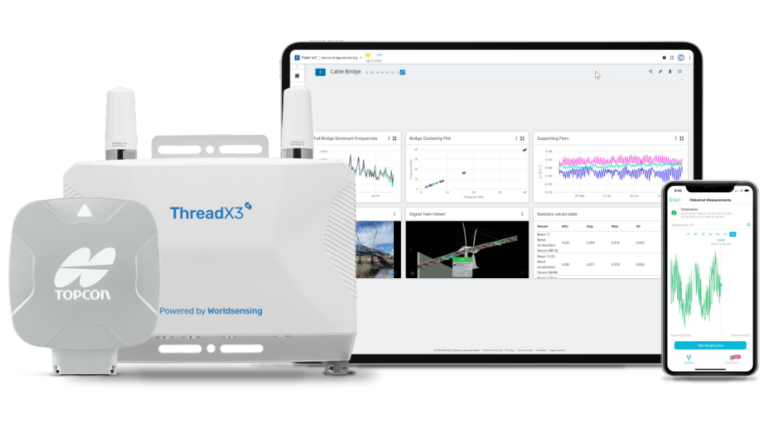
A. The sensemetrics Thread is an advanced connectivity and edge computing device, providing secure communication and direct interface controls for complex, high-power, and high-frequency devices like robotic total stations, variable frequency drives, multiparameter weather stations, shape arrays, accelerometers, cameras, and many more. It also can connect directly to one or many MUX devices to support dense sensor requirements of 100+ per location. Each Thread simultaneously serves a secondary role as a secure gateway for connection of wireless sensors, including Geokon Geonet nodes and smart sensors that communicate using the MQTT protocol.
For low power, low frequency geotechnical sensors there are connectivity solutions such as Geokon Geonet, RST rStar, Loadsensing, and Ackcio Beam, that are a more economic means of connecting low-cost sensors. sensemetrics cloud provides administration and data management for all of these wireless products – giving customers choice in selecting the best mix of connectivity solutions for their project.
Q. Once the project is completed, what is the frequency of readings after construction?
Wesley Saunders, P. Eng.
A. For this project, there are various monitoring frequencies that are being used post construction. These range from none in less critical areas to up to 3 months for more critical locations. Typically the monitoring frequency would ramp down over this period – an example would be weekly for the first month, biweekly for the second month and monthly for the third month. Of course, decisions to continue or forego monitoring need to be based on the conditions encountered during the project work and not necessarily limited to what was written into the initial monitoring program.
Q. How do you know the direction of movement on “directional/movement” type instruments? In the sensemetrics app, you only see delta x and delta y. Can you customize the axis names?
Todd Roberts, P.G.
Xtilt and Ytilt are the base metrics generated by the biaxial tilt sensors installed. After connecting the sensor to the platform, the user is prompted to provide additional properties that can be used to transform these metrics into a surrounding geospatial context. For example, after defining location, sensor azimuth, and structure azimuth – the platform will present users additional metrics for calculation of Northing/Easting tilt and Transverse/Longitudinal tilt. These properties are applied at run-time, and are not pre-processed against the raw metrics – allowing users the flexibility of changing these values at any time and rendering the entire historical record for the sensor to reflect the updated properties. This data model and calculation architecture provides ultimate flexibility to users and retains the integrity of the original observations as a true system of record.
Q. How do you define critical points to secure with the monitoring?
Wesley Saunders, P. Eng.
A. There are many considerations when determining critical points for monitoring. For each project and site you should evaluate risk events based on the consequences of the potential event as well as the probability of occurrence. From this evaluation you can determine which risk events are acceptable, which need to be monitored, which require insurance as well as which are not acceptable and therefore require improvements in the project design.
Q. How is the data collected being used and who is using it? Often the data is just collected and performance is not evaluated until something happens or a trigger is set off. Should we rely on computers to monitor the facilities or should we include a human?
Todd Roberts, P.G.
A. The data is being collected via sensemetrics Threads or GKM’s Loadsensing gateway and end node combination and loaded directly into sensemetrics software for access by assigned and authorized users. The sensemetrics platform is designed to be operated and maintained by a human user. sensemetrics’ platform is a tool that simplifies data collection, data management, and processing; all under human oversight. In doing so, the operator of the system becomes more efficient overall and is able to manage larger data sets, manage more frequent readings which reduces risk, and can ultimately reduce overall monitoring costs in a relatively short period of time.
Q. Do you input the sensor data into engineering software and how easy is that process?
Todd Roberts, P.G.
A. Our mature and secure sensemetrics API provides both REST and subscription data connections for standardized and secure data access by Third Party Applications. Integrations with industry-leading analytical applications provides best-in-class solutions for critical operations.
Q. Is it possible to accurately eliminate the temperature effects, and is it sensor dependent?
Wesley Saunders, P. Eng.
A. With a large dataset you can empirically correct for the variations of readings due to temperature however it must be used carefully. The variations in readings can be caused by three main parts, first is the temperature effect on the performance of the sensor chip itself which can be lab calibrated relatively easily, second is the thermal expansion and contraction of the mounting hardware for the instrument and third is the associated movement of the structure itself. These second and third factors can be difficult to assess proportions to and are specific to each individual installation location. As such you need to exercise caution when applying manual data corrections as you have potential to remove true movements that are being caused by the coefficient of thermal expansion of structures like tunnel sections.
Q. How do you deal with fluctuated data on Tilt meter readings? How do you interpret TIL readings if no rotation center can be determined?
Wesley Saunders, P. Eng.
A. We find there are a couple ways to manage data fluctuations on tilt meters. One method is to increase the measurement frequency compared to the reporting period and to present the median or average value, this would be similar to the data averaging feature that sensemetrics includes in their graphing functions.
Your second question highlights one of the significant limitations of the tilt meter as a sensor. It is a point measurement and can only be truly representative of the condition at that specific location. We tend to use tilt meters in combination with other instruments such as tilt beams, which provide a much larger measurement gauge, as well as survey prisms or convergence meters such that we have comparative measurements to help confirm assumptions used in interpretations.
Q. How complex is the back-end of sensemetrics compared to other competitors for initial setup? Is it manageable by the user or does someone from sensemetrics need to perform the setup?
Todd Roberts, P.G.
A. sensemetrics was developed so that any user can set up a monitoring system with minimal technical training. Most projects that utilize sensemetrics are installed by the end user with minimal up-front training in a sensemetrics certification course.
Q. Can the sensemetrics platform be used fully-locally – for example in applications where Internet access is not possible, such as in mining in remote areas?
Nathan McGee | Technical Director, sensemetrics
A. sensemetrics does offer an on-premise solution that we call sensemetrics Enterprise. This product has some limitations compared to cloud computing, but in specific cases is a good option for owners to begin their process of collecting and standardizing sensor data on-site. Although this solution is not as common as our cloud solution, the Enterprise platform can be easily migrated to a cloud-based system as connectivity becomes more widely available with minimal infrastructure upgrades.
Q. How can the data be shared with the operations control room of the city of Toronto and First Respondents for crisis management?
Todd Roberts, P.G.
A. We offer a few options. Data can be directly shared with the City of Toronto by providing users a secure account on our platform, applications can query sensor data programmatically using our REST or subscription API, and/or through data export utilities that we have made available – including our Microsoft Excel plugin. This range of tools and interfaces were developed to provide owners like the City of Toronto options about how they integrate condition monitoring data into their larger decision making processes and systems.
Q. How are you uploading manual data? Do you upload inclinometer manual readings? Where is the data stored?
Wesley Saunders, P. Eng.
A. Manual import of survey data is being completed by creating individual position sensors similar to how you would with an AMTS. Readings are then recorded with date, time and position and imported as a data record using .CSV files. For the manual inclinometer data, a typical software such as GTILT or SiteMaster are used to produce a PDF output file which is then saved in a document control registry. All data for the project is stored in a cloud server.